| Ad Clicks |
Displays the number of times viewers of a banner click on an ad to view the full offer. |
| All Users |
Total of new users and returning users for a given period of time. |
| Assisted Conversions |
Google's measure of any interaction, other than the final click, that led to a consumer converting on a website.
|
| Assisted Value |
The total value of the conversions assisted by the channel.
|
| Attribution |
The process of assigning credit for sales and conversions to touchpoints in conversion paths.
Attribution allows marketers to quantify each channel's contribution to sales and conversions. For example, many people may purchase on your site after searching for your brand on Google.
Refer to this Google Support document for more information. |
| Avg. Time on Site |
Displays the average length of time a visitor spent on a particular page or set of pages. |
| Avg. Value |
A calculation of Event Value / Total Events. |
| Bounce Rate |
Displays the percentage of single-page visits (i.e. visits in which the person left your site from the page they entered through without going deeper inside your site). |
| Completions |
The total number of users who have completed all elements defined for a particular goal.
|
| Conversion |
A completed activity, online or offline, that is important to the success of your business. Examples include a completed sign-up for your email newsletter (a Goal conversion) and a purchase (a transaction, sometimes called an Ecommerce conversion).
Refer to this Google Support document for more information. |
| Conversion Rate |
The number of conversions is divided by the number of total ad clicks that can be tracked to a conversion during the same time period.
|
| Cost |
The total cost of Google AdWords campaigns, in currency units defined by the Google account user. |
| Channel Grouping |
A roll-up of traffic sources in the Acquisition reports that groups several marketing activities together. Channel groupings allow you to view and compare aggregated metrics by channel name, as well as an individual traffic source, medium, or campaign name.
Refer to this Google Support document for more information. |
| CPC (Cost Per Click) |
Cost-per-click is the average cost an advertiser paid for each click on search ad(s).
|
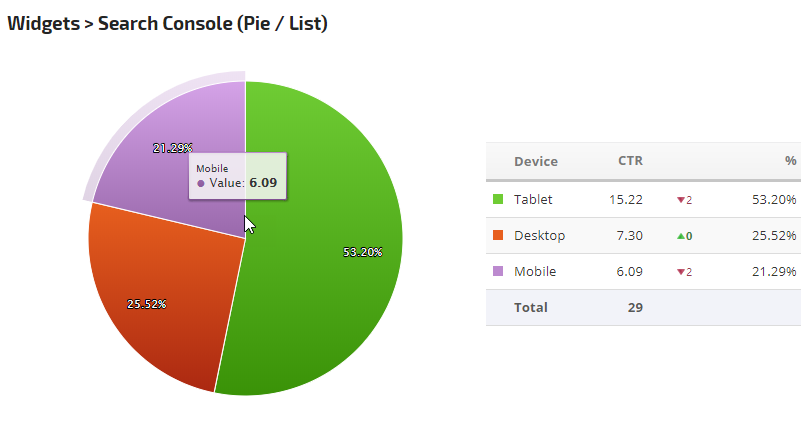
| CTR (Click Through Ratio) |
Displays the Click-through-ratio for an ad. This is equal to the number of clicks divided by the number of impressions the ad received. |
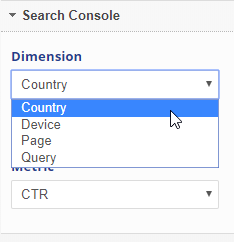
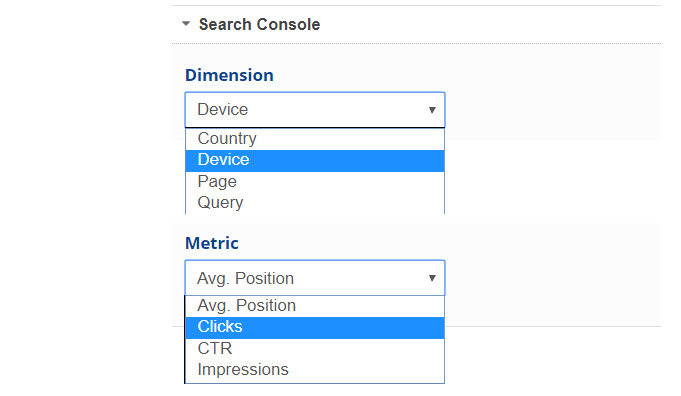
| Dimension |
A descriptive attribute or characteristic of an object that can be given different values.
For example, a geographic location could have dimensions called Latitude, Longitude, or City Name. Values for the City Name dimension could be New York, London, etc.
Refer to this Google Support document for more information. |
| Event |
A type of hit used to track user interactions with content. Examples of user interactions commonly tracked with Events include downloads, mobile ad clicks, gadgets, Flash elements, AJAX embedded elements, and video plays.
Refer to this Google Support document for more information. |
| Event Value |
A calculation of Total Event * Value. |
| Exit Rate |
How often do users end their session or leave the site after viewing a particular page |
| Goal |
A configuration setting that allows you to track the valuable actions, or conversions, that happens on a site or mobile app.
Goals allow you to measure how well your site or app fulfills your target objectives.
Refer to this Google Support document for more information. |
| Hits |
An interaction that results in data being sent to Analytics. Common hit types include page tracking hits, event tracking hits, and e-commerce hits.
Each time the tracking code is triggered by a user’s behavior (for example, the user loads a page on a website or a screen in a mobile app), Analytics records that activity. Each interaction is packaged into a hit and sent to Google’s servers.
Refer to this Google Support document for more information. |
| Impressions (Ads) |
The measurement of how many times an ad is shown. |
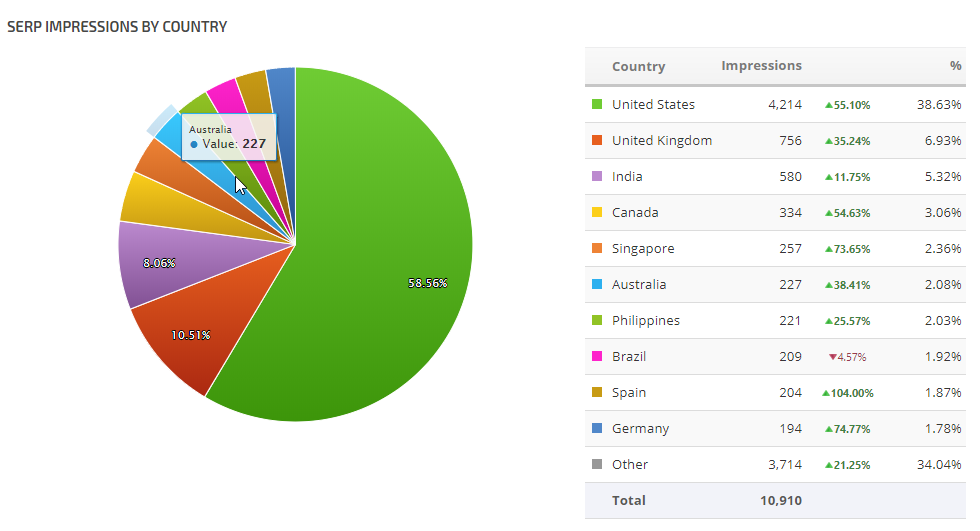
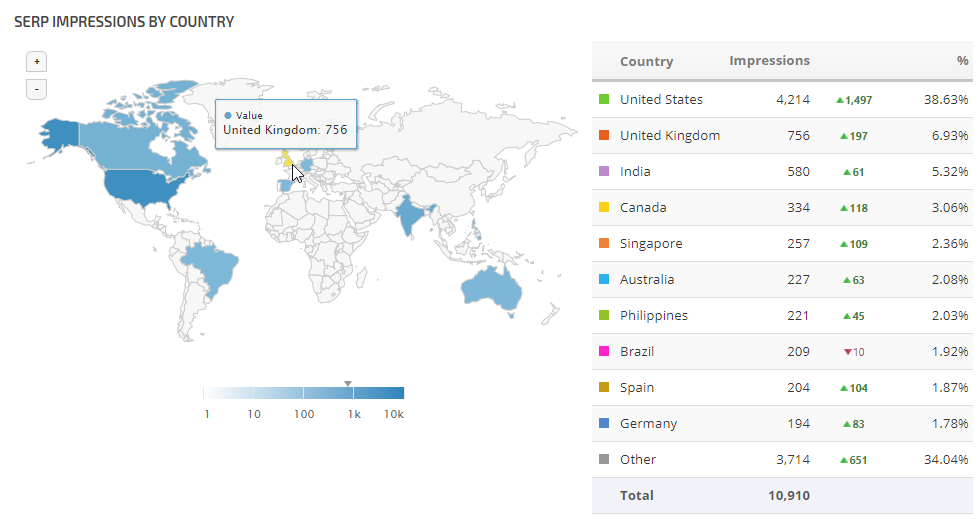
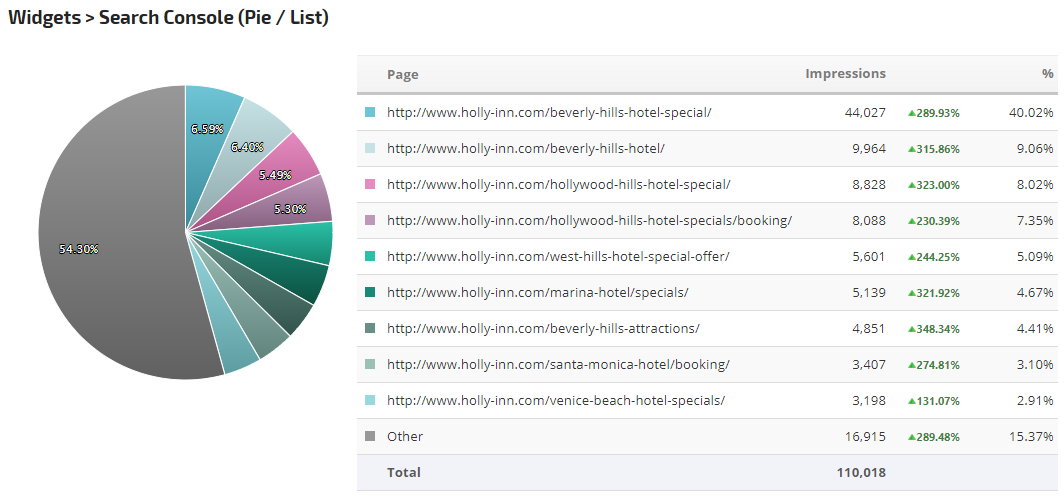
| Impressions (Search Console) |
An impression is the display of a website link in search results or an advertisement. This metric accounts for the total number of impressions recorded by Google for a website or ad campaign.
|
| Last Interaction Conversions |
The ratio of assisted/last interaction conversions. This is a number that indicates whether this channel primarily results in last interaction conversions or is predominantly assisted conversions. Numbers of 1.5 and higher indicate that this channel is predominantly accounting for assisted conversions, while numbers closer to 0 indicate the channel’s contribution to conversions is predominantly as the last interaction. |
| Last Interaction Value |
The total value of the conversions completed by the listed channels.
|
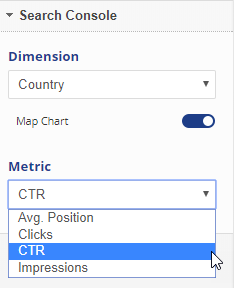
| Metric |
Individual elements of a dimension that can be measured as a sum or a ratio.
For example, the dimension City can be associated with a metric like Population, which would have a sum value of all the residents of the specific city.
Refer to this Google Support document for more information. |
| New Users |
New Users is based on Google's ga:newUsers metric and represents the number of sessions marked as a user's first sessions. |
| New Users % |
New Users % is based on Google's ga:percentNewSessions metric that represents the percentage of sessions by users who had never visited the site before. It does not represent the number of new users between one period and the previous. In this Google Developer document, it is described as the calculation of ga:newSessions / ga:sessions |
| New Visits |
Displays the number of new visits by people who have never been to the site before. |
| Organic Traffic |
Number of users who find your website ‘organically’ through search results, as opposed to via a paid ad, clicking a link on another site, or from a bookmark they already have saved.
|
| Paid Traffic |
Number of visitors to your site who came there via Google Ads, paid search keywords and other online ad campaigns.
|
| Pageviews |
An instance of a page being loaded (or reloaded) in a browser.
Pageviews is a metric defined as the total number of pages viewed.
Refer to this Google Support document for more information. |
| Permission |
The right to perform administrative and configuration tasks, to create and share assets, and to read and interact with report data.
Refer to this Google Support document for more information. |
| Property |
A sub-component of an Analytics account that determines which data is organized and stored together.
Refer to this Google Support document for more information. |
| Revenue |
Specifies the total revenue or grand total associated with the transaction (e.g. 11.99). This value may include shipping, tax costs, or other adjustments to total revenue that you want to include as part of your revenue calculations.
|
| Roll-Up Reporting |
A feature of Roll-Up Properties, which aggregate data from multiple source properties into a single property.
Refer to this Google Support document for more information. |
| Sampling |
The practice of selecting a subset of data from your traffic and reporting on the trends detected in that sample set.
Refer to this Google Support document for more information. |
| Segment |
A subset of sessions or users that share common attributes.
Segments allow you to isolate and analyze groups of sessions or users for better analysis.
Refer to this Google Support document for more information. |
| Session |
The period of time a user is active on your site or app.
By default, if a user is inactive for 30 minutes or more, any future activity is attributed to a new session.
Refer to this Google Support document for more information. |
| Sessions with Event |
The number of sessions during which an Event was recorded. |
| Source / Medium |
Source: the origin of your traffic, such as a search engine (for example, google) or a domain (example.com).
Medium: the general category of the source, for example, organic search (organic), cost-per-click paid search (cpc), web referral (referral).
Refer to this Google Support document for more information. |
| Tags |
Referring to Google Tag Manager, a Tag is a snippet of JavaScript that sends information to a third party, such as Google. The Analytics tracking code is an example of a tag.
Refer to this Google Support document for more information. |
| Total Events |
A total of Events (executions of a specific action) that occurred on a website during a specified period of time. |
| Unique Events |
The number of unique events that occurred on a website during a specific period of time. |
| Unique Page Views |
The number of times a page was viewed during a specific time period.
|
| Views |
The number to views a website or specific web page received during a report period. |
| Visits By Medium |
Displays the number of visits by medium through which your site was reached. For example, every referral to a website also has a medium. Possible mediums include: "organic” (unpaid search), "cpc” (cost per click, i.e. paid search), "referral” (referral), "email” (the name of a custom medium you have created), "none” (direct traffic has a medium of "none”). |
| Visits By Source |
Displays the number of visits by source that brought visitors to your website. For example, every referral to a web site has an origin, or source. Possible sources include: "google” (the name of a search engine), "facebook.com” (the name of a referring site), "spring_newsletter” (the name of one of your newsletters), and "direct” (users that typed your URL directly into their browser, or who had bookmarked your site). |

