Search our Knowledge Base
Search

Bing Ad Groups Performance


The Bing Ad Groups report provides data on the performance of ad groups in the Bing Ad account that has been connected to the domain's campaign in Rank Ranger.

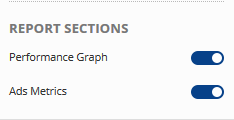
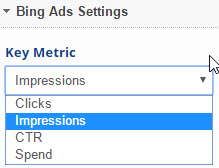
The report includes a graph displaying the results associated with the Key Metric you select (clicks, impressions, CTR, or spend) as well as a variety of ad group metrics displayed in tabular format.

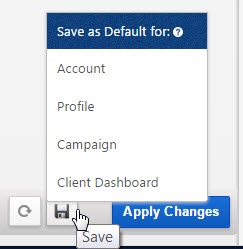
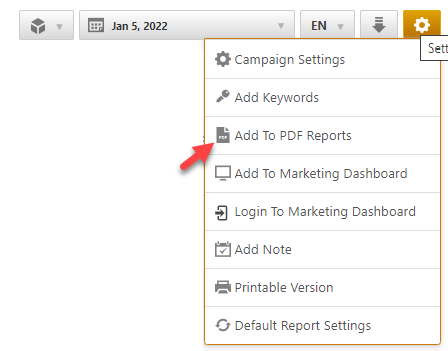
The graph and tabular presentations of Bing Ads data can be either displayed or hidden based on user preference, and like all Rank Ranger reports, it can be added to a client dashboard, a marketing dashboard or 
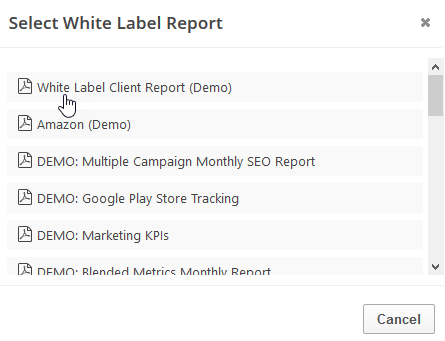
automated PDF reports that are sent by email.

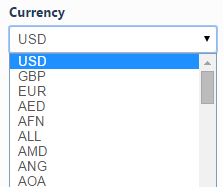
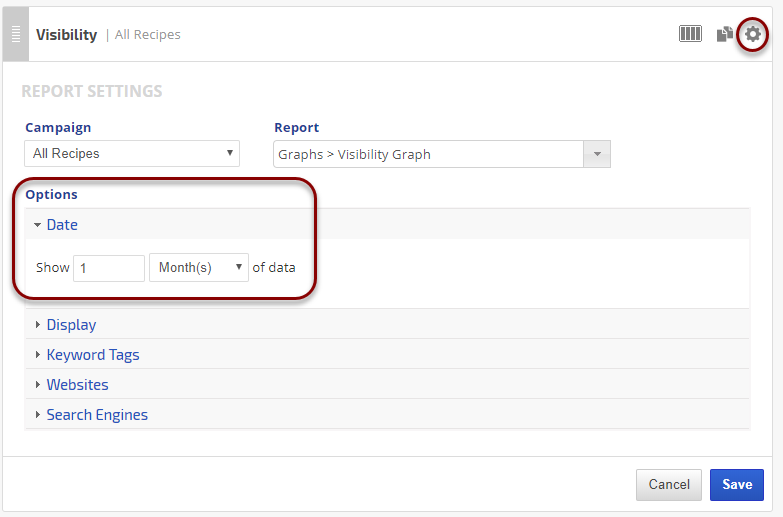
Important! In order to view this report, you must authorize a connection to a Bing Ads account.
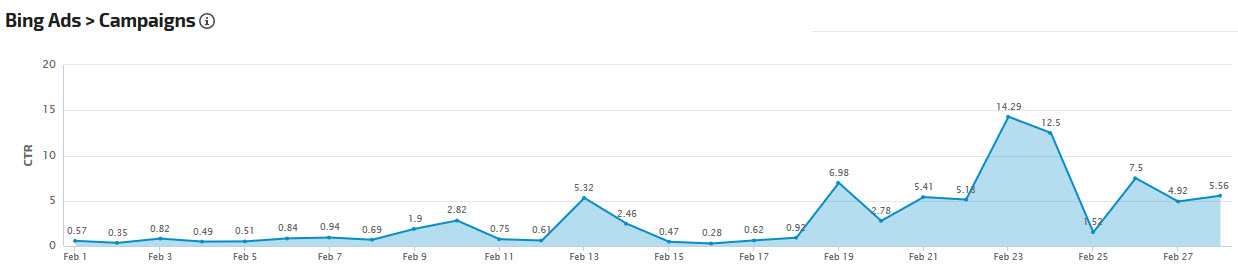
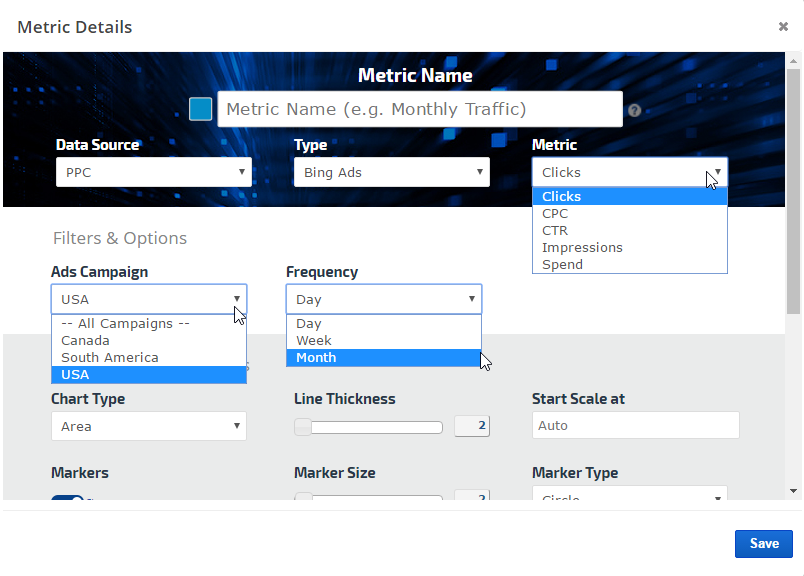
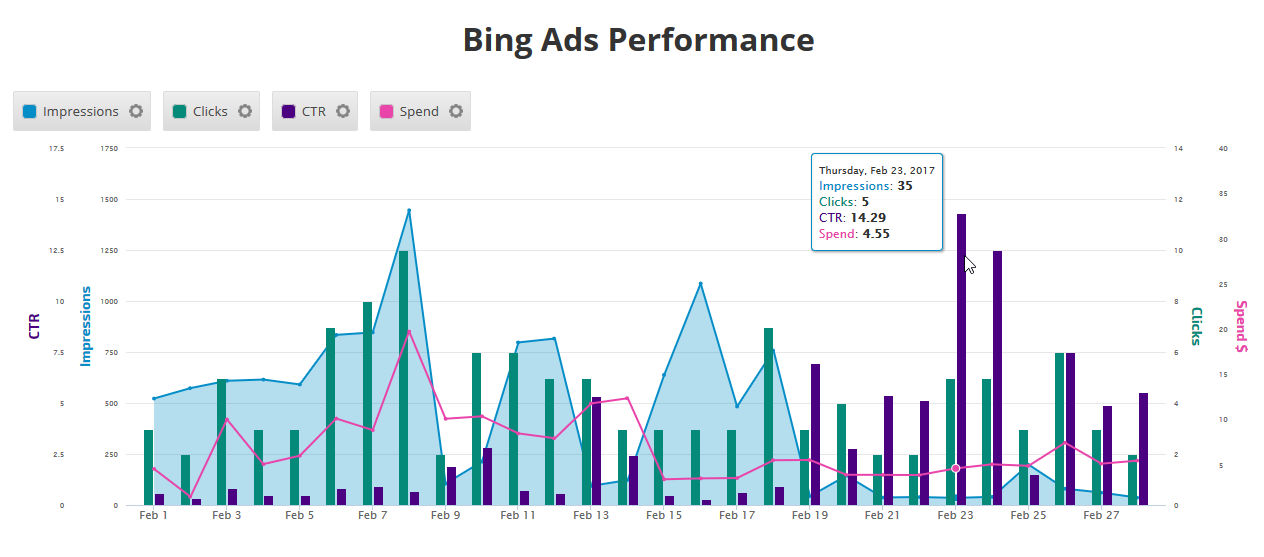
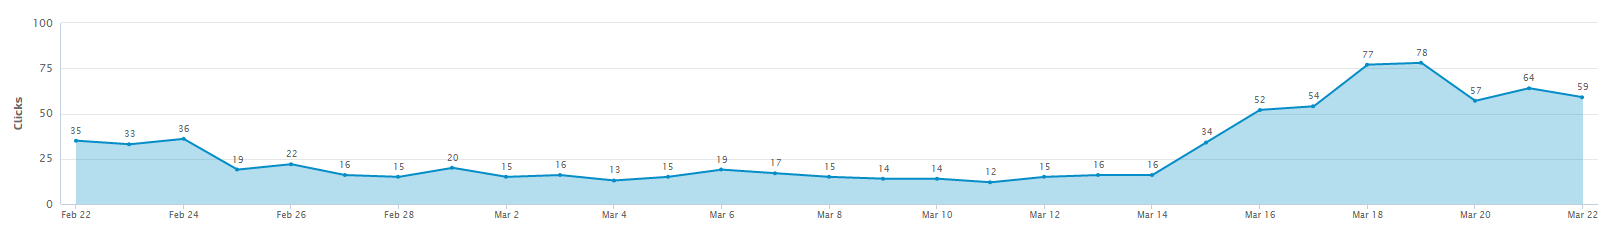
Bing Ads Ad Groups report with Metric Widgets in white label marketing dashboard
 

Ad Groups Performance Graph


The Bing Ads Ad Groups Performance graph displays the results associated with the Key Metric you select in the Report Options (e.g., clicks, impressions, CTR, and spend) for the date range you have chosen.
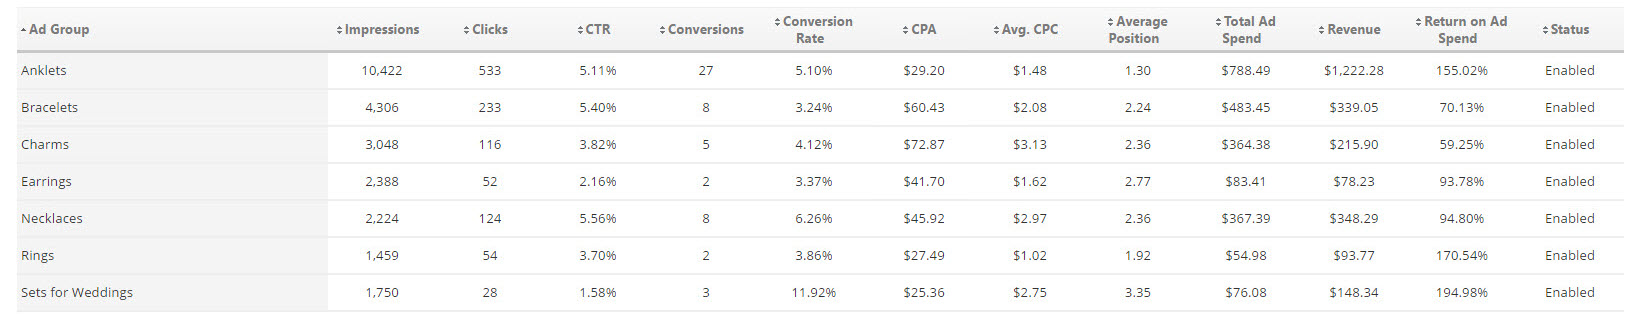
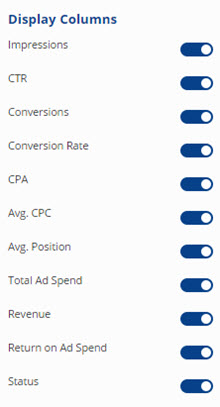
Bing Ads Ad Groups Traffic Graph


Ad Groups Metrics Table


The Ad Metrics table displays the Ad Group name, ad impressions, ad clicks, CTR (click through rate), conversions, conversion rate, CPA (cost per action), average CPC (cost per click), average ad position, total ad spend, revenue, return on ad spend and the ad group's status (Enabled or Disabled).

The table can be sorted by any of the columns, either in ascending or descending order, by clicking on the header of the column you want to sort by.

Bing Ads Campaign Metrics Table


Bing Ad Groups Performance Dashboard

 
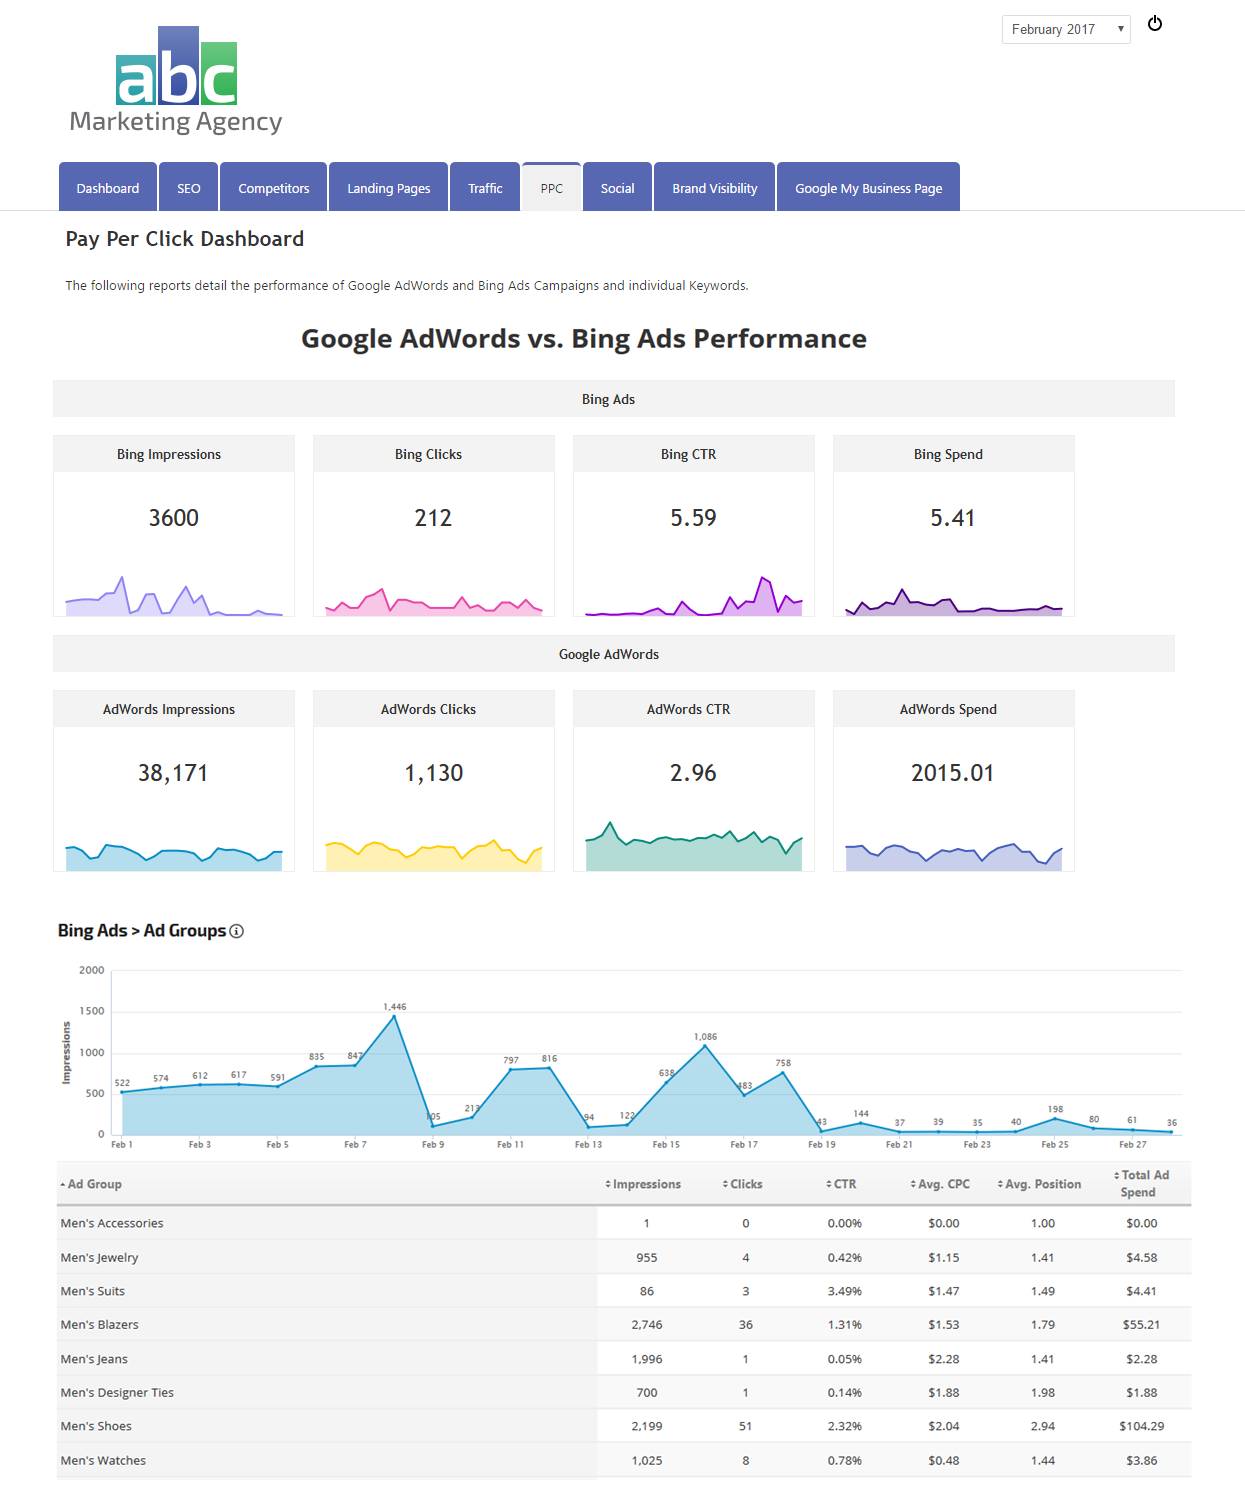
Bing Ads Reports & Graphs
A white label marketing dashboard can be used to highlight Bing Ads performance. 
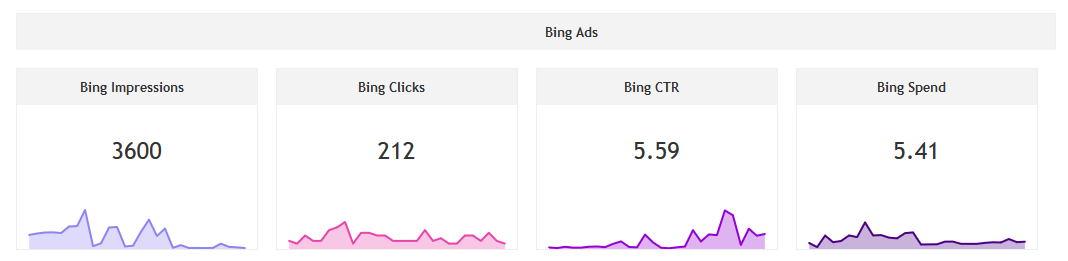
In this example, a text box is used to introduce the report that includes Metric Widgets comparing PPC metrics from Bing Ads and Google AdWords campaigns, followed by the Bing Ad Groups Performance graph trending impressions, and a table displaying all available metrics (you may choose to highlight specific metrics and hide others). 

Bing Ads Ad Groups report with Metric Widgets in white label marketing dashboard


Report Options


Date

Date:

 
  • Click the calendar icon to select the Report Date range or select a Custom Date Range in the top right toolbar
Important! Be sure to choose a date range for which data exists for the specific ad group in the Bing Ads account
General Settings

General Settings:

 
  • Enter a custom report title that will be centered across the top of the report (optional) 
Report Sections

Show or Hide Report Sections:

 
  • PPC Performance Graph displays at the top of the report
  • Ad Metrics Table
Key Metric

Select the Bing Ads Key Metric:

 
The Key Metric determines the type of data displayed in the Performance Graph
  • Clicks - the number of clicks on your Bing ads for each ad group
  • Impressions - the number of times your Bing ads were displayed on Bing SERPs
  • CTR (Click Through Rate) - The percentage of times users clicked on your ads when they were displayed on the SERP (calculated as clicks divided by impressions)
  • Spend - Total cost of the clicks for each ad group
Display Columns

Display Columns:

  
  • Impressions the number of times your Bing ads were displayed on Bing SERPs
  • CTR (Click Through Rate) - The percentage of times users clicked on your ads when they were displayed on the SERP (calculated as clicks divided by impressions)
  • Conversions - The total number of conversions resulting from clicks on the ad group's ads
  • Conversion Rate - The number of conversions divided by the total number of clicks
  • CPA (Cost per Action) - Total cost divided by the number of conversions
  • Avg. CPC (Average Cost per Click) - The total cost of all clicks divided by the total number of clicks
  • Average Position - The average position of the ad group's ads on the SERP
  • Total Ad Spend - The total cost of all clicks
  • Revenue - Total revenue from conversions (revenue per-conversion times the number of conversions, calculated using a per-conversion revenue amount provided by the administrator) 
  • Return on Ad Spend - Revenue divided by spend, expressed as a percentage
  • Status - Column showing the ad group's status in Bing Ads (Enabled or Disabled)

Currency:

 
  • Select a Currency symbol type from the list of world currencies. The currency option is available in case Bing doesn't send us the correct currency settings. We don't run a currency conversion, we simply display the numbers that pass from Bing to Rank Ranger, and you have the option to set the currency symbol based on what you have set up in the Bing Ads account.

Filter by Bing Campaign(s):

 
  • Select which Bing Ads campaign(s) to display in the report
Save Report Default

Save

  • Important! Click the Apply Changes button.
Save As Default Settings (if desired)
  • Account Default
  • Profile Default
  • Campaign Default
  • Client Dashboard Default
Refer to Report Default Settings for more information about default setting features and uses.


Bing Ads Custom Graphs & Widgets

More

Bing Metrics

More

Bing PPC Performance Reporting

More

Add to PDF Report

More

Add to Marketing Dashboard

More

Get the ultimate SEO tools with the Rank Ranger Software
Learn More About Rank Ranger